- All measurements below using ICOM SM-8 microphone with tone set just below middle, the way most people report good audio.
- The ALC or COMP was set to full black line or 20 dB.
- The power level was 100 watts peak.
- I read the same text as evenly as possible from a book.
- Measurements were on USB (upper sideband)
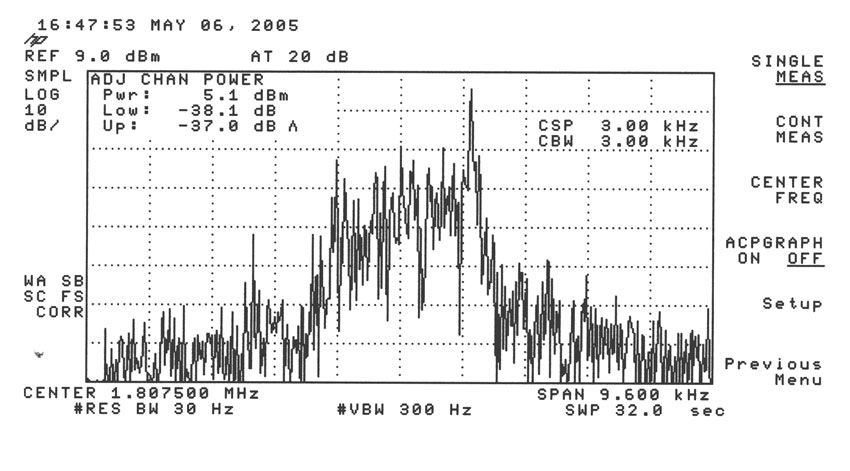
The measurement below is adjacent channel peak power with each channel set for 3 kHz bandwidth. You can see peak power is down about 37 dB from the main channel on adjacent channels. Some of the spikes you see far off frequency are caused by the poor leading edge ALC response of the 751A.
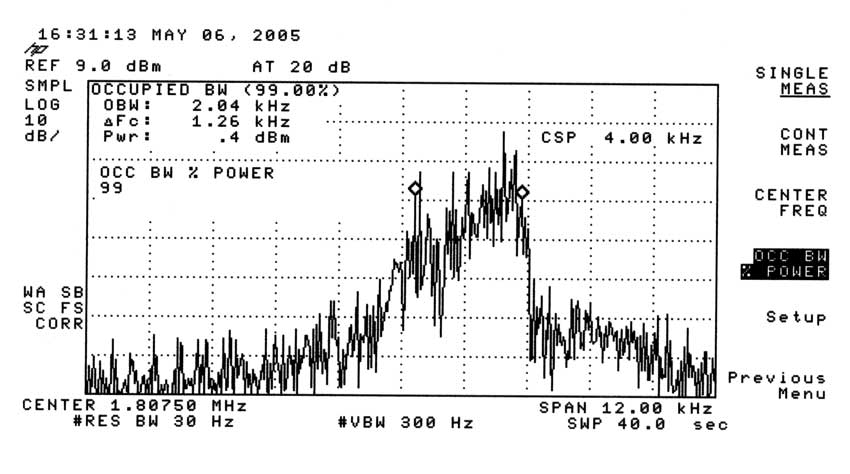
The measurement below is occupied BW for 99% of peak power. You can see 99% of the 751A transmitter power is within 2.04 kHz of bandwidth.
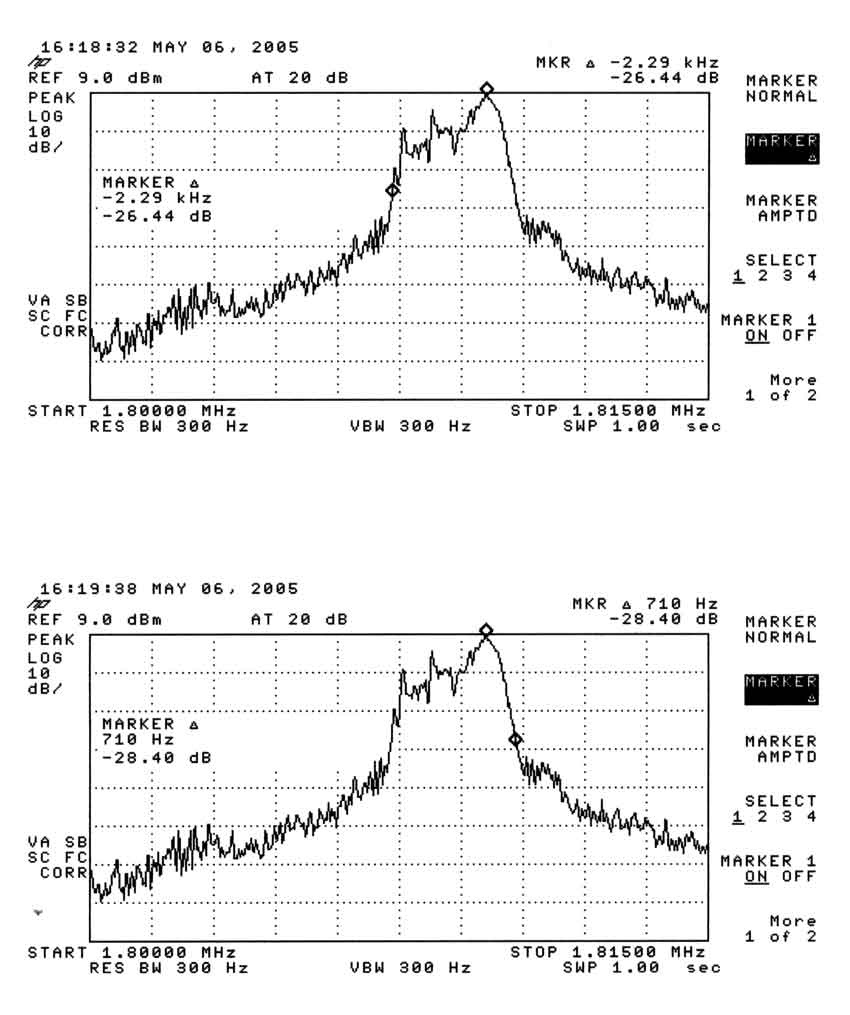
The data below shows worse-case peak signal levels during processed speech using the "COMP" function of the 751A set at 20 dB. In this case analyzer BW is 300 Hz, so we should deduct the shape of analyzer selectivity from the resulting displayed data (other measurements are 30 Hz BW, so we can ignore IF bandwidth of the analyzer). Even without doing that and with processing we see -26 dB points are 3 kHz using PEAK power. We can be sure with processing on the 751A easily meets -26dB @ 3 kHz.
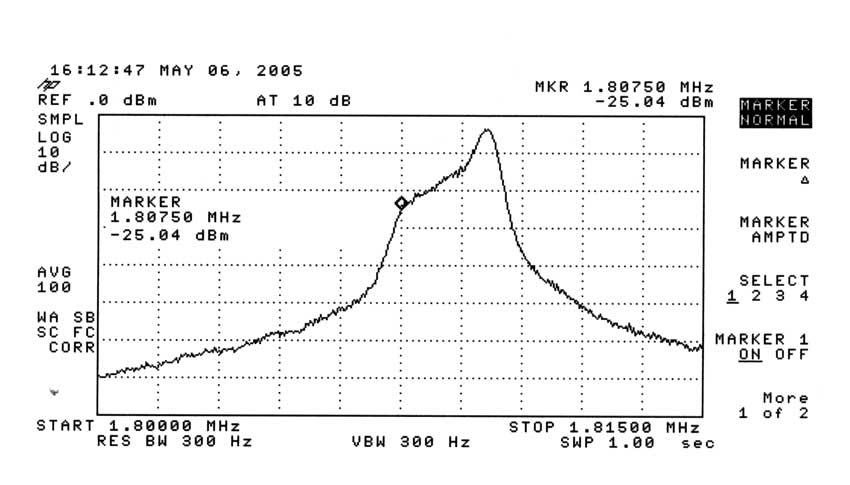
100 sweep (almost two minutes of talking) RF power distribution using my voice the way I normally run the 751A, without processing.