©2003-2012 W8JI
Revised 8/24/03
Revised May 18, 2005 R84 named in error R89 in harmonic adjustment
Major revision June 24, 2012
Warning!
Some MFJ manuals were re-written and distance-to-fault measurement procedure errors were introduced. I think this occurred sometime around 2002, but was later corrected. If your manual tells you to tune to the next band up or down when measuring any length process (stubs, DTF, etc.) it is absolutely incorrect. The correct procedure is to tune for lowest Z on the meter and lowest X on the digital display, set the reading as "1", and then locate the very next dip UP or DOWN in frequency and store it in "2". You can tune either up or down from the initial null spot, but the next dip must be the very next frequency up or down where meter Z is lowest and X on the digital display is as low as possible. I'm not sure if any other errors were introduced in the manual rewrite.
|
History: My amigo JB was the primary MFJ259B designer, and I helped with firmware algorithms and RF and analog hardware. This information is here because it is the correct way to calibrate the MFJ-259B analyzer. This work is all donated. K1BQT took an instruction set supplied by MFJ, originally developed by JB, and re-wrote it. I reviewed, modified, and edited that work. This page is the most current result. It is best that no one copy this, and start handing it out in mass. The only reason for this request is there must be a point of control of information, so it can be corrected or expanded as modifications, errors, or omissions show up. I am not aware of any other source that gives correct calibration procedures. It is important that the MFJ259B be calibrated by these steps, even if they sound complex. Without following these steps many special functions may not work correctly, even if the unit tests properly on calibration loads! |
Please, try to read the manual!
Impedance readings are least accurate
when near 1:1 SWR. When adjusting a normal antenna, lowest possible SWR is
always lowest reactance. There might be exceptions to this, but the would only
occur if antenna or load changes resistance (real part) much faster than
reactance. I doubt this will happen.
If you see 1:1 VSWR, the impedance
has to be 50 j0. Do not waste time trying to make the analyzer read R50 X0 if
SWR says 1.0:1 or some acceptable SWR number. Even a few bits of error, or a
very small stray voltage on the connector, will affect the algorithm that
determines reactance. The firmware was supposed to contain an algorithm
that weighs the VSWR with priority over Vs and Vz used to determine impedance.
As sometimes happens, there is no assurance everyone stayed on the same page. I
did not write the code, I only suggested changes to minimize error. SWR readings
should be used to smooth R and X readings around 1:1 SWR, but I do not have a
high level of confidence that guideline was followed.
The most common simple failures are dirty band switches, broken antenna connector pin connections (this is fairly new, caused by a manufacturing change in the circuit board), and voltage impressed on the antenna connector from the antenna or load (not just broadcast stations).
This is an inexpensive bridge directly coupled to the feedline.
There is no RF or dc isolation from the connector to the bridge. This makes the
bridge sensitive to dc, low frequency ac, and RF voltages on virtually any
frequency from dc to light.
TEST: Broadcast RFI, or even low
frequency AC or DC voltages on the cables will produce errors. The easiest way
to check for these errors is to put the analyzer in Frequency Counter mode and
carefully observe the SWR meter. If the SWR meter deflects at all in the
Frequency Counter mode, the analyzer is being biased from the antenna port by
something.
I do NOT suggest using a low pass or high pass. I suggest using the MFJ device specifically designed as a bandpass filter. The MFJ device, properly used, will not seriously affect other readings like low pass or high pass filters do from filter passband ripples and phase shift.
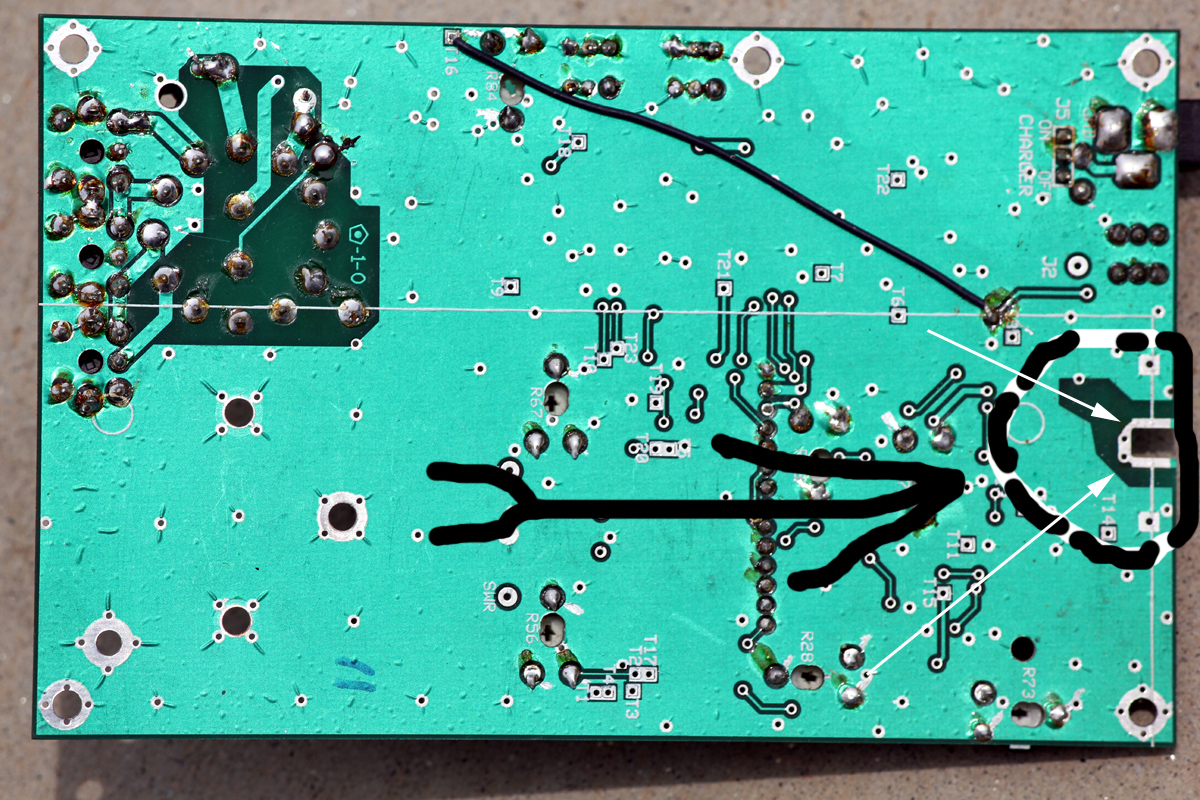
At some point after lead free solder was used, someone thinned down traces where the connector pin solders to the board. This was an idiotic mistake. Instead of just using a proper size and temperature iron to solder the pin with proper training, someone altered the board. While this allows solder to flow better, the traces are too weak to support the mechanical stress on the pin. There have been, off and on, attempts to use a jumper wire. That also was a really bad idea, the wire breaks.
This is the board area they changed. Thinning this trace down to improve soldering or using a solid wire is a serious mistake.
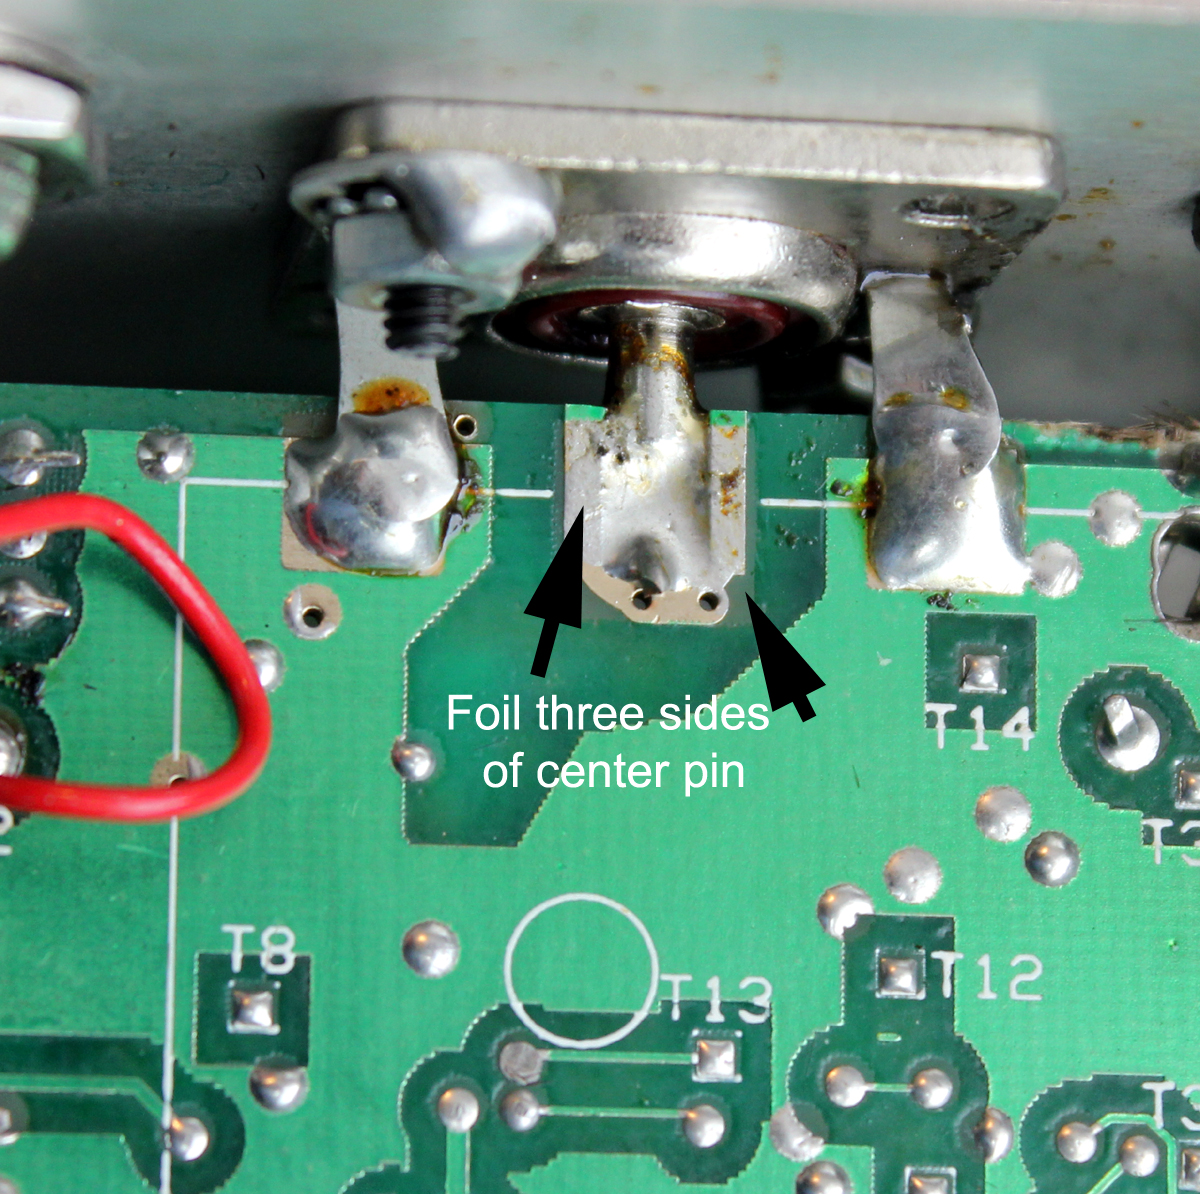
Good original board as engineered:
Correct pin soldering on good board:
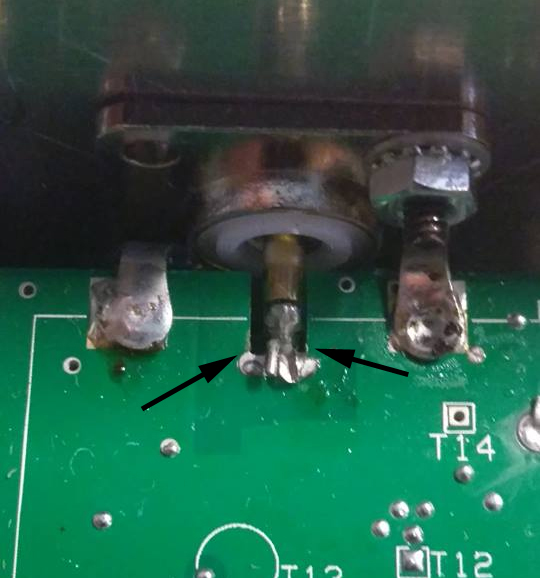
Revised defective pin area. Instead of teaching people to solder with correct tools, they thinned this trace. This ruins the connection life.
Another common issue is a dirty band switch. This shows specifically as a really jumpy frequency, even to the point the frequency reading goes way out of band or stops. This is a problem with switch grease and switch manufacturer quality control. The switch needs a little polishing and wetting of the contacts. Don't get all hyper about what cleaner to use. WD40 will work fine. Lay the analyzer on it's back, remove the switch knob, and spritz just a ting bit of normal WD40 on the shaft, allow it to run down into the shaft bushing. Run the switch back and forth rapidly. Do not soak the switch, but use enough to wet the switch internals and soften the internal grease.
Note: A dirty switch shows as unstable or major erratic frequency readings. Minor jumping or drift in low digits is normal.
This type of analyzer contains an RF oscillator, a very linear amplifier to increase power, and an internal resistor bridge in a modified Whetstone bridge configuration.
Since it is designed to be inexpensive and simple, and since the design is aging now, there are a few pitfalls with this system.
The bridge is dc-coupled from an internal resistor bridge to the antenna port. Each leg of the bridge has a diode detector. This is the weak point for accuracy.
The bridge detectors are NOT frequency selective, and respond to anything from minor dc offsets through microwave signals. This causes inaccuracies if any voltage over a few millivolts appears across the antenna port. (This is also true for competing analyzers from other manufacturers.) There are multiple reasons why, at the time of design, these units were dc coupled with broadband detectors. Hopefully someday a higher cost-design with selective detectors will become available, but for right now this is all that is available for amateur use from any manufacturer.'
The MFJ259 series RF power level is about 10 dBm, although this varies with the load impedance. Since the bridge depends on nulls, any external voltage will throw off readings.
The second shortfall is the internal amplifier must be linear and have very low total harmonic content. Total harmonic power, at the lowest load impedance, must be down at least 25dB and preferably 35dB. This is true for ANY antenna analyzer, since you do not want the analyzer to measure the load at two frequencies!
Because the detector is broadband and because it is dc coupled to the antenna, any external voltage across the antenna input port causes measurement errors. It is the accumulated voltage of multiple sources that is most important, not the strength of any individual signal. Because of that, large antennas should be tested at times when propagated signals in the range of the antenna's response are at minimum strength.
A definite RFI improvement occurs with a special parallel-tuned bandpass filter, but multiple-section bandpass, low pass, or high pass filters cause impedance measurement problems. Multiple-section filters behave like transmission lines of random line impedances, loss, and electrical length as frequency is varied. The best solution is to use a single-stage bandpass filter and dc isolation on large arrays or with long feed lines. I often use a good 1:1 isolation transformer for measurements, and often find a parallel L/C filter (like the MFJ-731 Filter) useful.
The bridge can be thought of as a simple voltage divider.
Voltage across Vz is R2/(50+R2) * 255 = bits
Voltage across Vs is 50/(R2+50) * 255 = bits
With 12.5 ohms R2 we have 12.5/50+12.5 * 255 = 51 bits Vz
and 50/12.5+50 * 255 = 204 bits Vs
Using this, it is possible to calibrate the 259B with higher values of load resistance. This may provide better high impedance accuracy.
This circuit is expanded to a bridge:
Other than manufacturing errors, the detector diodes clearly stand out as the most common problem. They are the most easily damaged devices in the analyzer. If you have a sudden problem, it is most likely a defective detector diode. Diode damage almost always comes from accidentally applying voltage on the antenna port.
Why are the diodes so sensitive?
In order for the detectors to be accurate within a fraction of a percent (one bit), detector diodes must have very low capacitance and very low threshold voltage. This means the diodes, through necessity, must be low-power zero-bias Schottky microwave detector diodes. The same characteristics that make them accurate and linear also cause the diodes to be especially sensitive to damage from small voltage spikes. ALWAYS discharge large antennas before connecting them to the analyzer! Never apply external voltages greater than 3 volts to the antenna port!
Measuring Stub and Fault Distance
I developed the distance to fault and stub length functions. The theory is frequency spacing between impedance minimums, when converted to half wavelengths, is the distance to an open or short. This requires the open or short be a reasonably good open or short, and not an antenna or load. This system works well, when applied properly. I successfully find opens and cuts in my trunk cables, some cables are 3000 feet long, within a few feet.
For a short period of time, with the best of intentions, someone rewrote various manuals. Unfortunately, they arbitrarily changed manual instructions for stub length and distance-to-fault measurements. For a period of time, as a direct result of this error, MFJ support instructed customers to ignore the older, original, and correct manual. The new manual, now long out-of-print, advised tuning for the second impedance dip on the next band-range up or down from the first dip. This is absolutely wrong.
The original manual was correct. Whatever your particular manual or verbal instructions might say, this is the only proper stub and/or distance to fault tuning method:
Note: Measurement errors in stubs and cable lengths will occur if the harmonic null is not adjusted correctly in the 259B or 269! Setting a test point to a certain voltage, like 3 volts, is not fully reliable.
Bias Adjustment Errors
I designed the simple linear amplifier in the MFJ259B. The bias adjustment was never intended to be set to a fixed voltage at a test point. Some instructions tell users to set amplifier bias, which minimizes output distortion, to a certain test amplifier test point voltage. This method can be unreliable, and can cause stub and DTF (distance to fault) errors.
Proper adjustment should be accomplished by watching distortion, the best indicator of which are harmonics. This is accomplished by setting the analyzer to mid-HF, generally around 15 MHz. The analyzer is terminated in a low impedance, which places the highest load on the RF amplifier. A spectrum analyzer is bridged across the lower-than-normal load resistance. Bias is adjusted for minimum harmonic content, consistent with second harmonic being at least 25 to 30 dB below fundamental. This assures maximum accuracy with narrow band loads. If you use a receiver for adjustment, be sure the receiver is tuned to the second harmonic of the MFJ259B, and that the receiver is not being overloaded by the 10-15 MHz fundamental signal.
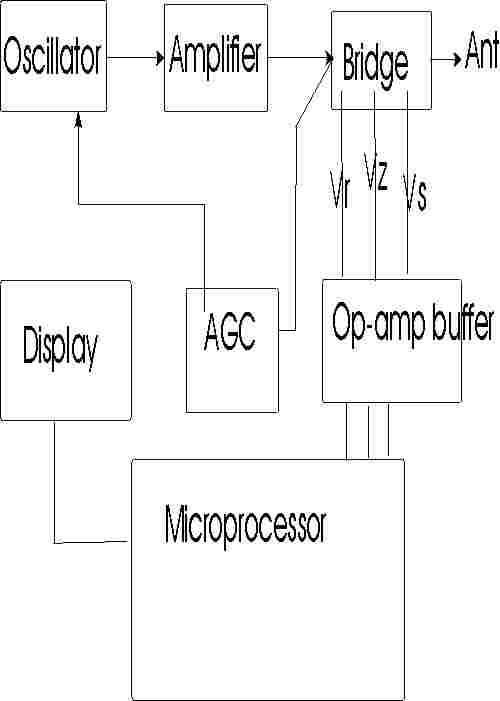
This is a rough outline of how this unit works:
The MFJ-259B, and other digitized MFJ antenna analyzers, compare three major voltages in a 50-ohm bridge circuit. They are:
All voltages are converted through an eight-bit A-D converter to a 256-bit digitized output with a test-display range of 0-255 bits. By knowing the ratio of these voltages, as compared to the AGC regulated RF source voltage, many different load parameters can be calculated.
An antenna analyzer could calculate everything (except sign of reactance) from measuring only Vs and Vz, but at certain impedances any small error in either Vs and Vz becomes critical. This is especially true when voltage is digitized into a 256-bit format (~0.4% steps). At certain impedances, an almost immeasurable voltage change will cause a sudden large jump in the measured impedance parameters.
When a load is reactive, the theoretical total of Vs and Vz exceeds 255 bits. Consequentially, if the 259's total Vz and Vs exceeds 255, the display indicates reactance. Although any calibration pot can affect readings, large reactance errors at impedance extremes commonly occur from improper setting of low-bit adjustments. Low-bit adjustments compensate diode linearity at low voltages.
To reduce display impedance jumping, SWR is weighed into the calculation of reactance and resistance at low SWR values. (An SWR bridge is most accurate when the load is closest to 50 ohms, which is a primary measurement area where impedance measurements through Vz and Vs become critical.) By factoring in a direct SWR measurement from an internal bridge, the analyzer can check and "correct" any small level errors in Vs or Vz. This reduces the impedance jump that would occur with a one-bit jump in voltage. This also why bits must be calibrated for near-perfect accuracy. A one-bit error can cause a resistive load to appear reactive (total of Vs and Vz must always be below 255 bits for a load to be considered resistive).
This calibration procedure is the correct procedure for later MFJ-259B's. Take any other information with a grain of salt. Since MFJ-259B firmware has several versions under the same model number, you may find some final performance or function verification steps invalid. These steps will involve parameters that do not appear on the display.
Before proceeding, be sure you have printed a copy of the board layout showing adjustment points, have read all this, and have suitable loads.
This unit has tracking and gain adjustments for Vz, Vs, and Vr. Detector system gain is set at high detector voltages or high-bits, by R53 (extreme SWR), R72 (Vz high load voltage bits), and R73 (Vs low load impedance, high-Vs series bits). Linearity is set at low voltages, by R90 (low load impedance), R88 (high load impedances), and R89 (low VSWR readings). Together, the low-bit and high-bit adjustments compensate diode linearity, making detector system output voltages closely track actual RF voltages appearing across bridge resistors.
| Control | Detector | Primary Load Calibration Function | determines |
| R73 | Vs high bits series load current | low load impedances, detector gain, high S bits | R and X low Z load |
| R90 | Vz low bit voltage across load | low load impedances, detector linearity, low Z bits | R and X Low Z load |
| R72 | Vz high bits voltage across load | high load impedances, detector gain, high Z bits | R and X High Z load |
| R88 | Vs low bits series load current | high load impedances, detector linearity, low S bits | R and X High Z load |
| R53 | Vr high SWR bits | high SWR readings, detector gain, high SWR bits | high SWR readings |
| R89 | Vr low SWR bits | low SWR readings and low reactances, SWR detector linearity | low SWR readings |
This unit also has meter calibration adjustments. The analog meters suffer from some scale-linearity problems, so they will be somewhat less accurate than the digital display in a perfectly calibrated unit. The metering adjustments, R56 (SWR) and R67 (Impedance), only affect analog meter readings. These meter adjustments do not affect the digital display, but digital detector adjustments will affect analog impedance meter readings.
Quiescent current (bias) in the RF amplifier section is adjustable. This adjustment directly affects output signal harmonic content. Harmonics are worse with low supply voltages, and with low impedance loads. Be sure you check the harmonics as outlined below, with a 1/4 wl open-circuit stub!!
Excessive harmonics can cause severe errors in measurement of frequency-selective loads, even when dummy-load SWR tests appear perfect. Loads most sensitive to harmonic-induced errors include, but are not limited to, antenna tuners, tank circuits, very short resonant antennas, and distance to fault and stub length measurements. If you notice something "funny" going on with a stub measurement, it may be a fault of incorrect bias.
Warning: Never calibrate around a sudden "problem" that appears. If a detector suddenly shifts voltage, the problem is almost certainly a defective detector diode. If the meter is recalibrated with a defective (leaky) diode, the meter will probably NOT track correctly with frequency. |
Tools and
Equipment:
#2 and #1 Phillips-head screwdrivers
Digital meter or accurate analog meter for checking supply voltage
Small set of non-metallic alignment wands for coils, and small jeweler's screwdrivers for controls
Well-filtered stable power supply, adjustable to 12-volts, or as specified
General-coverage receiver with level meter, or a spectrum analyzer
For stub testing and adjustments, a ~10 MHz 1/4wl open-stub. 15’ of good-quality solid-dielectric RG-8, with a UHF connector at on end, open on the other end, will work.
2.2-ohm 1/4 or 1/2 watt film resistor
Accurate load set to include:
A. Short
B. 12.5-W load
C. 50-W load
D. 75-W load
E. 100-W load
F. 200-W load
Note 1:
|
| Note 2: The power source should be the LOWEST expected operating voltage. DO NOT use a standard "wall-wart" or batteries! You can reduce voltage from a conventional 13.8v regulated supply by adding a few series diodes. Silicon diodes will normally drop about 0.6volts or so per diode. Three or four series diodes will reduce voltage below 12 volts. |
|
WARNING: The MFJ-1315 AC adapter or other "wall-warts" should NOT be used to power the unit for most alignment steps. It is best to calibrate at typical lower expected battery voltage. |
Visual Inspection: Before, during, and after calibration, be mindful of physical condition. Watch for missing or loose hardware. Do not tug, stress, or repeatedly flex leads, or carelessly flop or toss things about. Unlike my bench, keep your workbench clean. Follow these rules the entire time you have the unit apart!
Battery
Tray Removal: This step provides access to trim-pots and most inductor
adjustments.
[ ] Remove last two batteries at each end of the tray.
[ ] Remove two battery holder screws (right side) and extract the tray.
[ ] Always position the battery tray to minimize strain on wires.
[ ] Do not reinstall batteries. If the holder or leads get shorted, you can melt things.
Refer to the board layout below for specific adjustment locations.
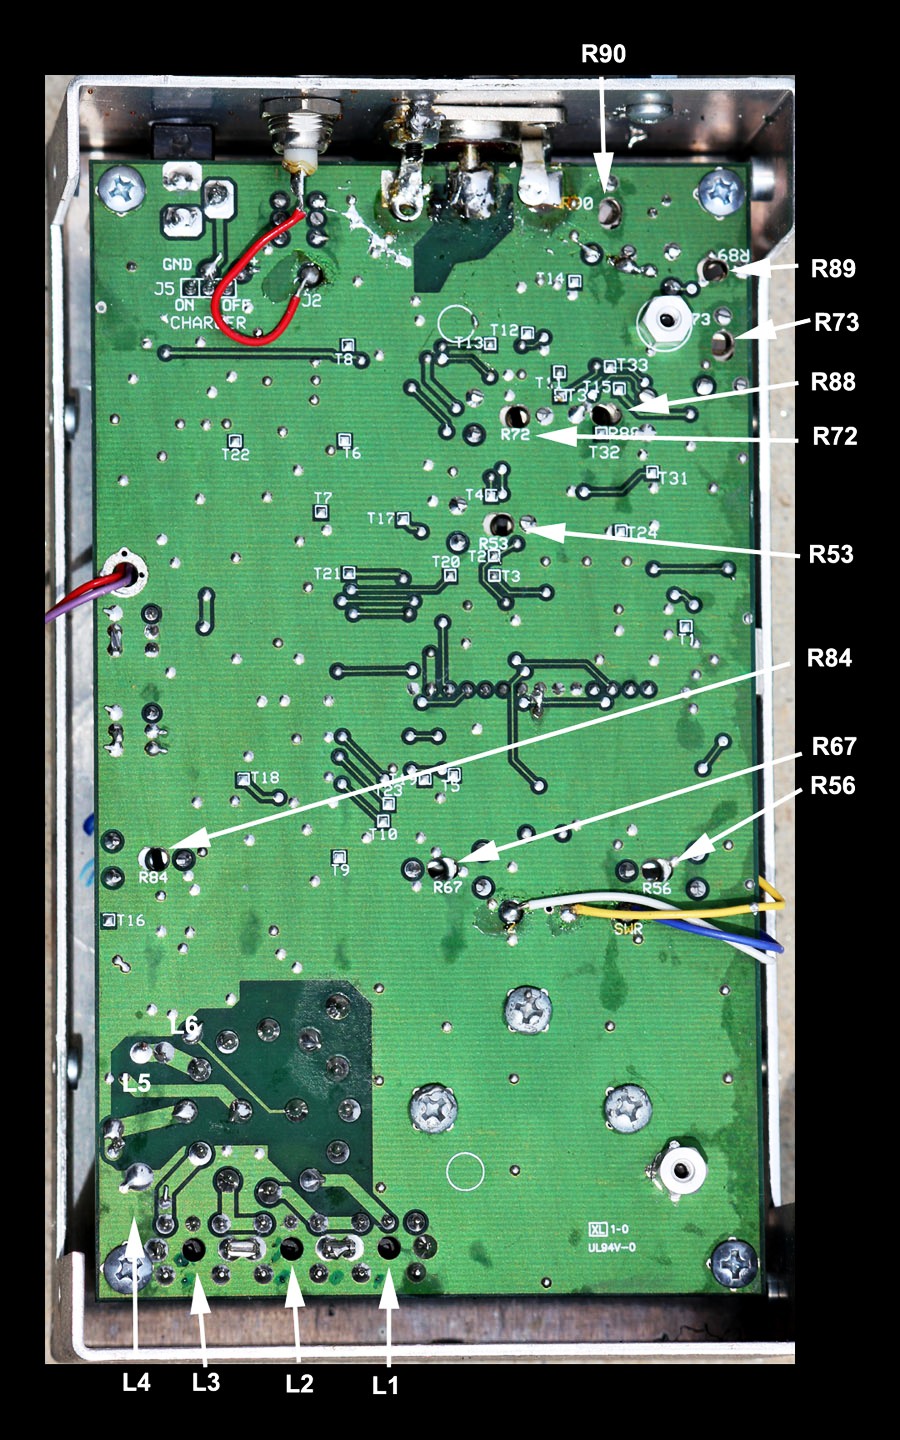
R90 Load Z low-bit
R89 swR low bits
R73 Series high bits
R88 Series low bits
R72 Load Z high bits
R53 swR high bits
R84 Amplifier bias null harmonic
R67 SWR meter
R56 Impedance meter
L1 Lowest range
L6 Highest range
Figure 1
Step 3, verify VFO range
Band Overlapping: Each band should overlap the next by a small amount to ensure gap-free coverage from 1.8 MHz to 170 MHz. While viewing the LCD Frequency Display, wiggle the bandswitch from side-to-side gently. Watch for any display or meter dropout. Starting from the highest frequency band, check each band as follows:
114-170 MHz: L6 oscillator squeeze-spread tunes from below 114.0 MHz to above 170.0 MHz. Check tune for dead spots.
70-114 MHz: L5 oscillator squeeze-spread tunes from below 70.0 MHz to above 114.0 MHz
27-70 MHz: slug oscillator tunes from below 27.0 MHz to above 70.0 MHz.
10-27 MHz: slug oscillator tunes from below 10.0 MHz to above 27.0 MHz.
4-10 MHz: slug oscillator tunes from below 4.0 MHz to above 10.0 MHz.
1.8-4 MHz: slug oscillator tunes from below 1.8 MHz to above 4.0 MHz. Check tune for dead spots.
While verifying band overlap, check the lowest and highest bands carefully for dead spots. The LCD Display will indicate 000.000MHz if a dead spot occurs. Dead spots generally indicate a defective tuning capacitor (TUNE).
If wiggling bandswitch causes a dropout, the switch may have dry or dirty contacts. Less likely are poor solder joints, but check solder joints first. If you must clean and lubricate the switch, be aware it is a difficult task. The entire board needs to be lifted from the case front. Dirty band-switch contacts may be restored with spray tuner-cleaners, or WD-40. The best place to spray the switch is from the front side (shaft side), right below the nut. You must remove the switch indexing tab retainer nut and the metal switch retainer (stop) under the nut. Be sure the stop goes back exactly as removed.
To correct overlap problems, locate and retune the appropriate VFO coil (see pictorial for coil locations). Note that L1-L4 are slug-tuned and require an insulated hex-head tuning wand. Using the wrong size or worn tuning tool may stress and crack a tuning slug.
Inductors L5 and L6 are located on the component side of the board and are compression-tuned (press turns closer together to lower frequency or spread apart to raise frequency). Make only very small corrections--especially to L5 or L6--and recheck the band you are adjusting. You should also check the next lower band after each adjustment to ensure that the lower band hasn't moved excessively.
| Important Warning: VFO coils MUST be aligned from highest frequency band to the lowest frequency band. All higher ranges affect lower bands, with the adjacent higher band having the largest effect. Do not attempt VFO coil adjustment unless you are experienced working with VHF-LC circuitry or analog tuned circuit alignment procedures. |
Harmonic Suppression/ generator bias level: Connect the analyzer exactly as shown below.
WARNING:
Incorrect
adjustment of R84 will NOT show with resistive dummy loads!!! The unit will appear to calibrate correctly, but will
produce errors in stub length, distance-to-fault, and other frequency-selective
or resonance functions.
When R84 is set properly, harmonic suppression of –30dBc or more should be possible across most of the analyzer’s tuning range.
This particular adjustment should be made at the lowest expected operating voltage. Proper alignment requires a 12.0-volt regulated supply as a power source. NEVER use an AC adapter, or any supply voltage higher than 12-volts, when making this adjustment.
A calibrated spectrum analyzer works best for monitoring harmonic
output, but a well-shielded general-coverage receiver with signal-level meter
will also work. The receiver MUST
be "T'd" into the analyzer just as the spectrum analyzer is, the "T"
and resistor must be located right at the analyzer ANT connector. If
you do not have a good-quality receiver or spectrum analyzer, you
probably should not make this adjustment. If you insist on adjusting bias
without a receiver or analyzer, you can connect a 1/4 wave open stub, tune to
the null in Vz, and watch test-mode Vz while adjusting R89. Vz will roughly indicate
total even harmonic voltage, when the analyzer is set at the stub's exact resonant
frequency. Entering the test mode is described in Detector Calibration (Step
6).
[ ] a. Install either a 15’ RG-8 open stub, or a low impedance load resistor and spectrum measurement device, and tune the analyzer to approximately 10-15 MHz or exactly to stub resonance.
[ ] b. (stub and internal Vz use only) Observing Vz on the data display (analyzer test mode), adjust frequency until the lowest fundamental output reading (or lowest impedance) is obtained. You should clearly see the MFJ analyzer's fundamental frequency output voltage (Vz) go through a deep null.
[ ] c. Observe the analyzer frequency reading. This is the approximate resonant frequency of the stub.
[ ] d. Without changing the analyzer test frequency setting, observe the second harmonic level. This harmonic will be at twice the MFJ analyzer frequency counter reading. Alternatively, you can watch Vz on the test mode display.
[ ] e. Adjust R84 for lowest 2nd harmonic meter reading on the receiver, lowest Vz test-mode reading, or lowest harmonic levels on the spectrum analyzer. Be SURE the fundamental frequency level remains nulled in the stub, if a stub is used.
This critical sequence calibrates A-D conversion for various load conditions. If you know your unit has been tampered with, preset trim pots R88, R89, and R90 to their center positions before continuing. If any control bottoms-out during adjustment procedures, you either installed an incorrect load for the control adjustment or the analyzer has a defective detector diode.
To prepare for detector tracking alignment, place the analyzer in Test Mode. Entering test mode may be tricky with some units, and it may take practice. To enter Test Mode:
[ ] Turn power off.
[ ] Hold down MODE and GATE buttons while restoring power.
[ ] As display comes up, slowly (about 1 second period) rock between applying finger-pressure on the MODE and GATE switches. The best method is to use two fingers, rocking your hand from side-to-side to alternate your fingers between the two buttons.
[ ] Confirm analyzer has entered test mode (it may take more than one try).
[ ] Using the MODE button, advance display to the R-S-Z screen (shown below).
![]()
![]()
![]() 10.000
MHz
10.000
MHz
For initial adjustments, if the unit has never been aligned, start here. Otherwise, skip down to the next break.
![]()
[ ] Tune
analyzer operating frequency to approximately 10-15
MHz. This is not critical.
[ ] Leave antenna connector Open
[ ] Set R72 for Z=255
[ ] Set R88 for S=000, if possible
[ ] Install the Short
[ ] Set R90 for Z=000, if possible
[ ] Set R73 for S=255
[ ] Set R53 for R=255
The list below is the start for any second or third run-through points, or calibration touch ups. You have now set initial rough settings for all three detectors, proceeding to impedance calibration loads
[ ] Install 12.5-W load
[ ] Set R90 for Z=051
[ ] Set R73 for S=204
[ ] Set R53 for R=153 (for 4:1 digital SWR)
Change Load to continue impedance calibration
[ ] Install 200-W load
[ ] Set R88 for S=051
[ ] Set R72 for Z=204
Change Load to continue impedance calibration
[ ] Install 12.5-W load
[ ] Reset R90 for Z=051
[ ] Reset R73 for S=204
[ ] Reset R53 for R=153 (4:1 digital SWR)
Change Load to continue impedance calibration
[ ] Install 200-W load
[ ] Verify or reset R88 for S=051
[ ] Verify or set R72 for Z=204
[ ] Verify or set R53 for near R=153 (4:1 digital SWR). This reading should be compromised with the 12.5 ohm load.
Change Loads to calibrate SWR
[ ] Install 75-W load
[ ] Set R89 for R=051 (digital 1.5:1 SWR)
[ ] Set R56 for SWR Meter 1.5:1
Change Loads to calibrate impedance meter
[ ] Install 50 ohm load
[ ] Set R67 for an Impedance Meter reading of 50-ohms
You have now set impedance tracking at 12.5 and 200 ohms, digital SWR tracking between 1.5:1 and 4:1 SWR, and set the SWR analog meter for 1.5:1 SWR point. There is not any analog SWR meter tracking adjustment, so you may want to compromise R56 with several SWR test loads. R56 will not affect anything except the analog SWR meter reading.
After verifying calibration with all loads, carefully reassemble your antenna analyzer.
Periodic Verification
Periodically check your analyzer with test load!
12.5W = (4) 50-ohm or a single 15W and 82W 1% in parallel
50W = 49.9-ohm or 100W and 100W in parallel
75W = 75-ohm or 150W and 150W in parallel
100W = 100W
200W = 200-ohm or 100W + 100W in series
I use male BNC connectors with the locking sleeve removed, with surface mount resistors. These connectors will plug into type-N 50-ohm connectors as "quick connect" connectors:
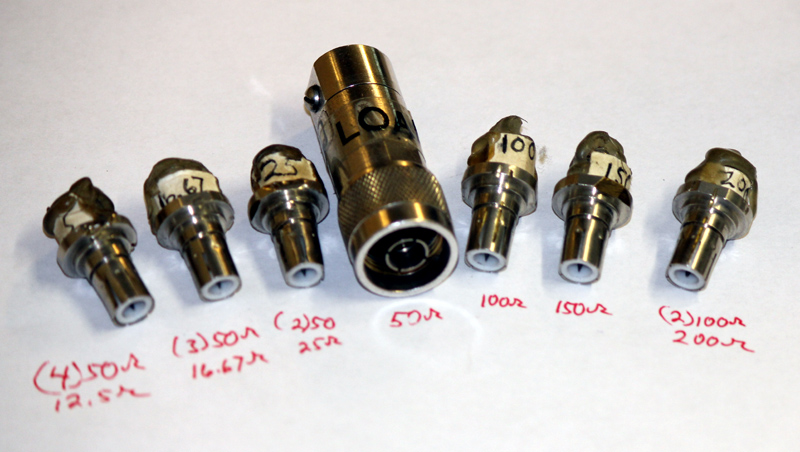
Important Note: Many simple HF loads, inside PL259 connectors, will not be accurate above 30 MHz. Only precision terminations should be used in the VHF region. Even then, there can be some errors from connector and trace lengths inside the analyzer. The MFJ-259B does not correct for connector impedance bumps, or correct for the electrical length between an external load and the detectors inside the unit.
©2003-2012 W8JI